Monday, May 18, 2015

BGT via FMECloud

FME Cloud

What is FME Cloud? Simply put : FME Cloud FME Server in the Cloud. FME Cloud is the first location-aware iPaaS ( Integration Platform as a Service) and that means you have all the FME Server functionality at your disposal, without the hardware . 
See the following link for more information on FME Cloud.
One of the many advantages of FME Cloud is the ability to activate processes via an external trigger (e.i. event driven ) . Examples of such an external trigger can be an e-mail or a sensor value change

BGT

The creation of the BGT ( or The Registration Large Scale Topography as Goggle translate calls it ) is in full swing , many of the stake holders are feverishly working on the assembly of this nation scale polygon map. The first stage is expected to be completed on January 2016. Stake holders deliver their part of the BGT to the national facility (LV) and it is from there made ​​available in CityGML format via PDOK (Dutch national SDI). For an overview of the already available BGT in the LV see: BGTWeb 
The CityGML format cannot be directly used in GIS applications or loaded into a database,  a format conversion (something FME is great at ) must first take place.

Event driven BGT2FGDB conversion.

FME is the tool for spatial data conversion and FME Cloud is the cloud tool for spatial data conversion :)

The trigger

The format conversion is carried out with FME Cloud and is started via a trigger, in this case the trigger is an e-mail . There are some conditions that the trigger has to meet in order to start the process, for example a selected map tile link should be provided.

The conversion

During the format conversion a number of format -specific adjustments are done. Examples of these changes include: removing specific format invalid characters , conversion to uppercase , null values ​​mapping, date conversions, new geometry is created (think of house numbering and street names labels)

The result.

The result is a uniform and complete BGT data set in FileGeodatabase ( FGDB ) format. The FGDB is a widely used and efficient GIS format . This format can be used in both closed- and open-source GIS applications. After performing the format conversion , the result is made ​​available via an e-mail with a download  link.

Advantages and properties of the conversion are : 

  • Easy to use. 
  • No application is required. 
  • Online and always available. 
  • Reliably and quickly. 
  • Outcome ready for database read-in action and GIS applications. 
  • Unique : There is no comparable data distribution method ( in the Netherlands)

Results displayed in QGIS


This product is designed for the Dutch market if you are interested and want to set up something similar please contact us via info@etlsolution.nl

Wednesday, January 14, 2015

My top 3 of FME 2014


Tomorrow is the unveiling of FME 2015 (exiting!), a good moment for me to look back at my top 3 for FME 2014.
Many great features were introduced in FME 2014 some I have used more that others and based on that I have created this top 3 FME 2014 list.


Number 3 - at my top 3 FME 2014 list.


The ability to save data directly from the Data Inspector.


This ability was present in the Universal Viewer and was temporarily unavailable in previous versions of the Data Inspector, luckily the ability was introduced back in FME 2014.
I have made considerable use of this functionality, sometimes as temporary mid-translation results and in occasions as full blown translation results.


Number 2 - at my top 3 FME 2014 list.

Canvas objects selection mode.

FME 2014 got a major face lift for the look and feel and when I occasionally use older FME versions it makes me shudder with amazement, not that older versions were that bad but still...how did I ever find the old looks acceptable?
I am now so used to the slick FME 2014 look that it makes me wonder if there can be any improvements to be made, will I get surprised again tomorrow? I sure hope so.
The ability to select canvas object overlapping the selection tool has proven to be a major improvement, which deserves a respectable second place.
This ability coupled with the objects alignment tools, make it a very powerful combined tool to easily rearrange, select canvas objects in particular and edit the canvas in its totality. Nowadays I couldn't live without it. 
The disappearance of the canvas grid was a major issue, according to a poll at the FMEUC this issue was found to be so major that it is returning in FME 2015.
I personally never really missed it and still don't understand what the fuss is about, my workspaces never looked so ordered!


Number 1 - at my top 3 FME 2014 list.

NULL support.

Bubkes
At the lunching of FME 2014, and even before full null support was introduced/announced. 
At the time I really wondered whether it will have such an effect on my dealings with data, I cant tell you that it did!
By representing null (and its variation) according to the format's manner of handling it, FME forced me to learn and understand each and every format I am using and it's handling of null values.
So in a very subtle and indirect way FME has taught me a great deal on many formats.
This for me is the number one reason why null support is at the top my 3 FME 2014 list. 


Looking forward to hear Don and Dale (always a pleasure) revealing new features and additions.
I am tuning in are you?

Wednesday, December 17, 2014

BGT 2 GBKN

The BGT.

The Registration Large Scale Topography (BGT) is a detailed topological digital map of the Netherlands in which all physical objects such as buildings, roads, water and land cover are unambiguously registered.

The last years the entire geo sector of the Netherlands is busy constructing this polygon based map that will ultimately replace the old line based map (GBKN).

This huge national endeavor encompasses ministries, national agencies, municipalities, provinces, companies and the national cadastral agency.

The transition from a line based map to a polygon map is not an easy one and requires continuous tunning and collaboration between the parties involved.

BGT in PDOK.

FME and the BGT. 

Pricipally this is a task that can be described as CAD to GIS conversion in FME terms.
Most of the dutch GIS companies are in someway involved by assisting the parties involved to assemble their part of the map.

Unfortunately a large sector of the civil engineering CAD users need to adjust their work methods to a polygon based map.

This is where FME can be used to reverse engineer the GIS map into a line based map, something that is more commonly used in the civil engineering CAD based sector.

BGT - CityGML format.

GIS 2 CAD with FME.


To demonstrate how easily this task can be done with FME, I am making use of a small part of the publicly available BGT obtained from the dutch SDI (PDOK). For more information on CAD 2 GIS translation and resource with FME see FMEpedia.


Step 1: Polygons 2 lines.

Converting polygons to lines is a no-brainer for a seasoned FME user, but you do need some tricks up your sleeve to successfully accomplish that for all of the polygon objects.

Step 2: Lines priority.

To prioritize the resulting lines I am using the AttributeValueMapper transformer, this is just one of the many way to do this, but for this example it is sufficient.

Step 3: Generating prioritized lines.

Once the priority is assigned it is a matter of making use of the priority by testing and reordering to achieve the desired results.

Final step: Writing to CAD.

Result DWG.
For the purpose of this demonstration I have created a DWG file for viewing the results. The visualization of the lines is not according to any template, but that is something that can easily be done with FME.

Real world example.

This demo is based on a solution already used by the municipality of Gorinchem.
The solution created allows the user to transform the polygon map into a DWG defined by a template file.


The solution also provides the user the ability to reorder the generated lines, set new visualization rules and decide with layers should be included in the output.

If you don't believe me, just ask Hans......

Small tip for reading the BGT in FME, use the CityGML reader with the imgeo xsd provided by Geonovum or simply download this workspace and follow the instructions.

Wednesday, October 22, 2014

Heat maps and FME.

Heat map.

Heat map.

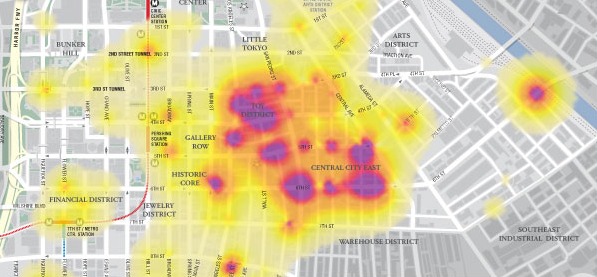
According to Wikipedia a heat map is a graphical representation of data where the individual values contained in a matrix are represented as colors.
In the past heat maps were mostly used in other sectors (biology, statistics, etc.) than the geospatial sector, where maps are the obvious way of data representation.
Nowadays there are plenty of resources to transform your data into a spatial heat map representation.


Google heat map.

The Google Developers site provides a multitude of resources and samples on how to used and incorporate Google's products. 
The Google Maps JavaScript demonstrates how a spatial heat map is created via a simple JavaScript.
Without going into too much details, the script's components include location data, a map center point and visualizations options (colors, gradients and additional functions)


JavaScript in FME.

If you mention JavaScript to an FME user, he will probably think you mean GeoJSON since that is the most common way for spatially representing Java objects (JSON or 'XML's Baby brother' )
There are dedicated readers and writers for JSON in FME and plenty of resources on the subject to be found at FMEpedia.
Since the script is essentially plain text, FME can be used to manipulate the script with a simple text writer.


Input.

highway location marker.
To demonstrate how essentially any spatial data can be represented by a heat map via FME, I made use of the national roads dataset (NWB) freely available via the Dutch SDI (PDOK)
The features used are highway location markers (point features) but also line and polygon features can be potentially represented via heat maps.

Workspace.

Actually it is a very simple workspace in which I am extracting the point coordinates into attributes, reprojecting them and concatenating them into the predefined order.
To extract the map center point a BoundingBoxAccumulator, CenterPointReplacer are used on the national border. Finally the CsmapReprojector transformer is used to bring it into the desired coordinate system (LL84).

Result.

The result is a html file that can be viewed with most browsers.
In this case I have only used FME on 3 script components and added some images into the header.
Potentially other components such as gradient colors and styling can also be directly manipulated.


The Netherlands - highway location markers heat map.


Wednesday, October 1, 2014

Georeferencing evaluation with FME.

FME and data evaluation.

FME is a great tool to validate and evaluate data (next to the many things you can do with FME)
There are plenty of resources available on the subject demonstrating FME's data validation and Q&A capabilities.

Data evaluation can involve different aspects and have many forms.
For this post I choose to evaluate how well a publicly available data set can be georeferenced (if you can add value to it and put it on a map, why shouldn't you...)
For any serious conclusions, you'll have to work it out yourself, since my main intention is to demonstrate FME capabilities (and not bad mouth anybody particularly...)

Data source.


The Dutch government publishes many data sets openly and the numbers are increasing all the time.
I choose to use the data set of the national education registry since it is highly dynamic and it contains addresses, which makes it possible to potentially georeference the features.

The data used is available in csv format, which can easily be accessed online via the CSV reader (just point it to the url). For limiting sorting and filtering the incoming data, see my previous post: Where clause on text.
This results in a continuously updated data source, which is great to have but poses a challenge when displaying the results.

 Georeferencing the data.


    For georeferencing the source data I am using the BAG Geocoding service, available via the National SDI.
    An easy way in FME to access the service is by a HTTPFetcher transformer.
    By constructing the URL in the transformer's text editor and making use of attributes values, a very flexible solution is created.

    BAG Geocoding service results.

    The BAG Geocoding service returns the location(s) in an XML snippet that translates into geometry and attributes. In case of ambiguity or lack of sufficient input, the service returns an aggregate geometry.
    Somewhere in the aggregate geometry the corresponding location and attributes can be found (well most of the times...)
    Using the total count of both georeferenced and failed features, simple statistics (percentage of correct georeferencing) can be gathered and used for display.

    HTTPFetcher

    Interpreting the results.

    Some of the 'failed' to georeference features do actually exist (BAG Web) and can be correctly geocoded by slightly changing the address used, see for example georeferenced (note the street tag) and not georeferenced (note URL used =  input address)

    Displaying the results.

    I am using Google Fusion Tables to display  the results since it is an easy way to share geographical information (article is in dutch)
    Also non-spatial data can be shared this way and the failed features are saved into a non-spatial Google Fusion Table. Needless to say FME supports both spatial and non spatial reading and writing of this format.
    Some limitations of this format are the number of features supported and that it is still considered an experimental format, something that unfortunately makes it less reliable.
    As mentioned before the input source data is updated frequently and in contrast the displayed results are static and present a moment in time.


    Map of results, created 1-10-2014.

    Findings and (possible) future developments.

    A way to keep the displayed results up to date would be to use FME Cloud, something I still have not got around to try. I imagine that using FME Cloud to run this workspace would not require almost any resources or adaptations, since most of the data is on-line.
    Some of the finding are:

    • Saving the source csv data is necessary due to memory issues (something that is easily done in the HTTPFetcher)
    • Another curious issue found is that using the postcode in the request string actually results in less features georeferenced.
    Don't forget that by the time you read this post the output might look very different.

    Sunday, September 7, 2014

    FME and 3D printing.

    3D printing.

    3D printing has been around since the 1980's, but it is only in the last few years that a real boom in its application has taken place especially for domestic use.
    The most commonly used format (e.i de facto standard) is the STL, which comes in two types (ASCII and Binary).
    3D print.

    STL format and FME.

    If you search for this format in the Readers and Writers documentation, you will find that FME does not support it.
    Well not directly since no reader or writer are available, but indirectly, because it is plain text and FME can create and write STL files.

    3DS to STL transformation.

    There are lots of 3D files available on the web, and since it was around lunch time... I have selected this fork for testing.
    3DS in the Data Inspector.
    The 3DS fork is represented as a IFMEMesh geometry, which is to say that it is composed of parts that do not necessarily have a topological or spatial relationship.

    These are also the parts that need to be represented in the STL format, adhering to simple format definitions.

    So its not surprise that with FME the mesh geometry can be transformed and written to the STL format.

    Workspace.

    The workspace is quite simple and there are but a few steps necessary.
    1. Firstly decomposing the geometry to its components.
    2. the coordinates are extracted into attributes, here is also where I drop the geometry since it is not needed anymore (get rid of anything unnecessary, another FME rule).
    3. Some formatting is taking place to represent the coordinates as floating point numbers (StringFormatter), although some applications export into STL without the floating point representation.
    4. Finally creating the output by aggregating the coordinate values and concatenation.
    A text file writer is all that is necessary to write the STL format.

     Result.

    Result STL file.
    Since FME does not support the STL format it cannot be viewed in the Data Inspector, but no worries there are plenty of visualization tools available.
    I am using the freely available Meshmixer to display the result.

    I dont have a 3D printer, so in case you have tried yourself to create a STL file with FME and printed the result, it would be great to know.

    Saturday, August 16, 2014

    Where clause on text.

    Where clause.

    A where clause in its basic form is used to filter features and is used with database formats.
    The use of a where clause can deliver workspace related efficiency, by resulting in only the features necessary for the translation.
    You can do much more in a database where clause (joins, sub-queries), but for the purpose of this post I will stick to its basic use (e.i filtering)


    Example.

    Inspired by Safe's blog post, I have downloaded some bird tracking data* from the Movebank Data Repository .

    The data comes in a csv format, which is considered a database format in FME, but is actually plain text. The goal is to present the features on a map.

    Cory's shearwater - going the distance.

    Data content.

    The csv file contains location information as lat/long coordinates among other types of sensor related information.
    For more information about the data see the readme file provided.


    Data transformation.

    read data that cannot be used ?
    To transform the location information into point features the VertexCreator transformer can be used.
    However when doing so, disregarding the first law of FME (which is?), the transformation will halt because some features do not contain values in the location columns.
    That can be easily solved by testing the data before creating the geometry. 
    But by reading the entire dataset and then filtering unnecessary (or unusable) features, you are reading more than is necessary and it is not efficient.
     

    Filtering while reading.

    To my surprise, I have stumbled across a new functionality in the csv reader, that enables such filtering.
    I say to my surprise, since I totally missed out on the announcement related to this addition.
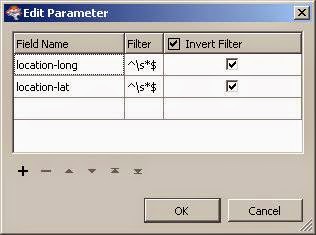
    This functionality is found at the csv reader parameters. First you have to enable it and then set it.

    According to the documentation: "The filtering is done by a regular expression string that will be compared against the values of attribute fields specified."

    This means that if you know your regular expressions, serious complex filtering can take place.

    For this case it is a simple string that filters the lat/long attribute fields, returning only columns in which values are found.
    Simple regular expression.

    Workspace.

    With and without filtering.
    This new functionality offer new possibilities that did not exist before FME 2014. And even if it's not a where clause as in a database, the abilities to filter and sort are welcome useful additions.


    * Gagliardo A, Bried J, Lambardi P, Luschi P, Wikelski M, Bonadonna F (2013) Oceanic navigation in Cory's shearwaters—evidence for a crucial role of olfactory cues for homing after displacement. Journal of Experimental Biology, v. 216, p. 2798-2805.