The end of the year is nearing and it is time to look back at the passing year and list my top 3 of FME 2016 functionalities.
At the same time its also a time to look forward to the coming year and the upcoming FME functionalities in FME 2017.
This year I actually wanted to combine both aspects into a double top 3, first my top 3 of FME 2016 functionalities and a second top 3 which involves a new FME 2017 functionality.

I hope I am not giving away a functionality that Safe intends to blog about, so if that is the case....my apologies in advance.
But personally I think that there will be so many awesome additions in 2017 that the little bit I am using doesn't even make a small dent in the pile of 2017 goodies that Safe can use to blog about.
My FME 2016 top 3
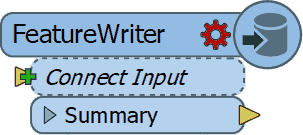
1. FeatureWriter
2016 started with the announcement (for me it felt more like a
meteor fall...) that in the future FME will be used without any
Readers and Writers
You probably all know what I am referring to, the birth of the
FeatureWriter,
the transformer that would
".... shake most FME users to their very core!"
I have to admit that initially I didn't see what all the excitement was about, but as the year worn on and I started using it more and more, I can tell you right now that I wouldn't know how I could have done without it! (well probably using a lot more workspacesto get the same job done)
So it's no surprise that it is by far the
number 1 on my top 3 for FME 2016 functionalities. Personally I think Safe succeeded in delivering what they promised and that the time of no Readers and Writers workspaces is
nearing.
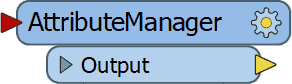
2. AttributeManager
The
AttributeManager was another FME 2016 functionality which slowly changes our approach into data transformation and in a good way.
No more AttributeCopier, AttributeCreator, AttributeRenamer, etc, etc necessary, a single super transformer to replace them all.
Personally I really like the AttributeManager for it capabilities, but there is one small annoying issue with it and that is the fact that it requires my attention way to often when the data schema changes.
So I have resorted to update the AttributeManager content when the workspace is finished, instead of continuously updating it. Despite that the AttributeManager makes so much possible with one single transformer and that is why it's my number 2 on the top 3 of FME 2016 functionalities.
3.WFS Paging settings
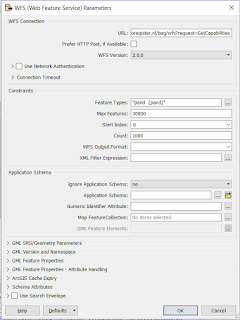
My
previous post was on this awesome functionality (secretly?) added to the WFS reader .
If you use WFS OGC services a lot then I bet you are as exited as I am about this hidden gem.
In the past I have demonstrated how to use
ResponcePaging in FME, but that required some inventive workaround to get all the features and overcoming the service's limitations.
Nowadays it's a matter of setting the reader settings accordingly, lean back and enjoy the logging happily passing by, while the service is queried.
For that sole reason, making my (and hopefully anybody that uses OGC WFS services) life easier I am giving the bronze medal to this FME 2016 functionality (my
number 3)
This concludes my personal top 3 of FME 2016, I had lots of fun playing around with data this past year thanks to Safe Software and their great product.
I am expecting to have as much, if not more, fun with the upcoming FME 2017 functionalities.
The other top 3
Since the FME beta is always
available and it's a great place to find out about new functionalities, I was searching for an idea for a post when I saw
this tweet from
@MadMansson which made me remember an
old post where a list of
certified FME professionals was created by parsing the HTML page of the Safe Software site.
So where does this all come together?
In FME 2017! where we can easily parse HTML with the brand new HTMLExtractor transformer (note to myself get cracking on CSS selectors).
So as a small homage to the previous post I put together a small workspace in which the countries with FME certified professionals are ordered by a ratio of the number of certified professionals per country divided by the country's area.
You might wonder what are the area units, well I just grabbed the first hit on Google for
world countries shape and it is in the LL-WGS84 coordinate system.
Another thing to mention is that when I initially made the workspace Luxembourg was number one, but as you see recently somebody joined the club (welcome!) and now it is Singapore leading the list.
According to the same shapefile there are 43 other countries with a smaller area than Singapore, so if you are from Macau and you plan to get certified, I can promise you an eternal first on this list :)
The HTMLExtractor transformer makes it easy to grab information from the web pages and I personally think we will see more web related functionalities coming in
FME 2017.
Looking forward to it!
Have a great New Year!


