Showing posts with label spatial transformation. Show all posts

Saturday, May 13, 2017

New annotation option in FME 2017

Annotations in FME

Annotations are an easy way to include description in a workspace.
There are 3 types of annotations in FME:
  1. Header annotations that are only generated when a workspace is generated.
  2. Summary annotations that are dynamic and reflect the changes in a workspace component (transformer, feature type, etc)
  3. Custom annotations are generally known as user annotations.

The image below shows all 3 annotation types.
The header annotations are above the reader and writer feature types and connection, the summary annotations is blue and describes the reader feature type, while the user annotation is by default yellow and empty of content.

The Magic of FME 2017

The #FMEWT is about to finish for 2017 and I had the luck to present in it, if you are interested in my presentation here is a link
During the preparation of the presentation I came across an unknown (for me) new functionality in the Workbench application.
This new functionality is the ability to transform ;) a summery annotation into a user annotation.
Just right click on the summary annotation and select 'Convert to Attached Annotation'

If you are a Copy& Paste kinda of a person, as I am, then this is mana from heaven.....
Now I can create a summary annotation and edit it, something that can save a lot of time.

So next to the Parameter Editor this is another excellent addition that can boost your FME development productivity.

Have Fun!

Saturday, January 14, 2017

PDOK Geocoder Service

The new geocoding service (Locatieserver)


The Dutch National SDI (Spatial Data Infrastructure) PDOK has recently introduced a new geocoding service (Locatieserver) that will in due time replace the current one.
The new service is very well documented, based on open source stack, available to all and the PDOK community is available for information about the service and eventual feedback. Naturally most of the information available is in Dutch.
For these same reasons I am not going to go into details about the services.

FME and the Locatieserver

Essentially  the geocoding service is an API and communicating with a API's is well demonstrated in the Safe Software Blog.

There are however a few issues that needs some mentioning, especially if you can't read Dutch ;)

  • The geocoding service is based on the BAG, the national building and addresses registration system.
  • The geocoding service enables you to choose from two different types of services. The free service, which is comparable to the current geocoding service and the suggest & lookup service that is composed of two endpoints that essentially work together.
  • The geocoding services offer a wide range of options that are not available in the current geocoding service.

Putting it all together

Back in 2013 when I started writing about FME and share examples on how to use it, there was no real easy way how to share your workspaces, beside the making them available for download of mailing them.
Luckily nowadays the FME Hub is incorporated into the Workbench application, which makes it very easy to grab a transformer created by somebody else.

For demonstration purposes I have actually decided on sharing a template and not a transformer.
My intention is to demonstrate how you can make a simple start with this service and FME especially when taking in consideration all the options this services provides.

PDOKLocatieserver template

The template

A FME template is a great way of sharing workspaces because you can incorporate the source data in it. In this specific case the source is an online CSV file that contains addresses of educational facilities.
As simple validation and clearing some duplicate data is done and then the service type selection is done via a Tester transformer and user parameter.
The geocoding services return JSON by default, but XML is also available for the XML savvies.

Both types of services return multiple results and each result as a score. The highest the score value the highest the probability that it's the best match.

Once the result with the highest score is sorted per request it a simple matter to transform it into a point feature with the GeometryReplacer transfomer.

I have selected to use the geometrie_rd attribute to which contains the coordinate values in the Dutch national coordinate system, if you are more internationally oriented the service also returns a set of coordinates in WGS84.

The results are written into a SQLlite database, a format that is supported by most of the open source and propriety GIS applications.

What to try it out yourself? first of all download FME 2017 (still in Beta while writing this post) and check out FME Hub for the template.

Have Fun!
    

Thursday, December 29, 2016

2016 in retrospect

The end of the year is nearing and it is time to look back at the passing year and list my top 3 of FME 2016 functionalities.
At the same time its also a time to look forward to the coming year and the upcoming FME functionalities in FME 2017.

This year I actually wanted to combine both aspects into a double top 3, first my top 3 of FME 2016 functionalities and a second top 3 which involves a new FME 2017 functionality.


I hope I am not giving away a functionality that Safe intends to blog about, so if that is the case....my apologies in advance.
But personally I think that there will be so many awesome additions in 2017 that the little bit I am using doesn't even make a small dent in the pile of 2017 goodies that Safe can use to blog about.

My FME 2016 top 3

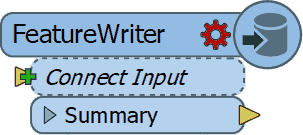
1. FeatureWriter

2016 started with the announcement (for me it felt more like a meteor fall...) that in the future FME will be used without any Readers and Writers
You probably all know what I am referring to, the birth of the FeatureWriter,
the transformer that would ".... shake most FME users to their very core!"

I have to admit that initially I didn't see what all the excitement was about, but as the year worn on and I started using it more and more, I can tell you right now that I wouldn't know how I could have done without it! (well probably using a lot more workspacesto get the same job done)

So it's no surprise that it is by far the number 1 on my top 3 for FME 2016 functionalities. Personally I think Safe succeeded in delivering what they promised and that the time of no Readers and Writers workspaces is nearing.

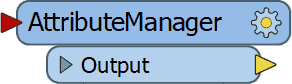
2. AttributeManager

The AttributeManager  was another FME 2016 functionality which slowly changes our approach into data transformation and in a good way.
No more AttributeCopier, AttributeCreator, AttributeRenamer, etc, etc necessary, a single super transformer to replace them all.

Personally I really like the AttributeManager for it capabilities, but there is one small annoying issue with it and that is the fact that it requires my attention way to often when the data schema changes.

So I have resorted to update the AttributeManager content when the workspace is finished, instead of continuously updating it. Despite that the AttributeManager makes so much possible with one single transformer and that is why it's my number 2 on the top 3 of FME 2016 functionalities.


3.WFS Paging settings
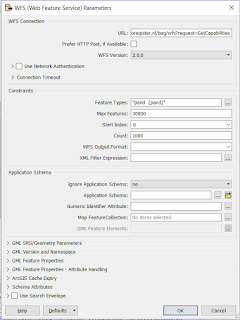
My previous post was on this awesome functionality (secretly?) added to the WFS reader .
If you use WFS OGC services a lot then I bet you are as exited as I am about this hidden gem.

In the past I have demonstrated how to use ResponcePaging in FME, but that required some inventive workaround to get all the features and overcoming the service's limitations.

Nowadays it's a matter of setting the reader settings accordingly, lean back and enjoy the logging happily passing by, while the service is queried.

For that sole reason, making my (and hopefully anybody that uses OGC WFS services) life easier I am giving the bronze medal to this FME 2016 functionality (my number 3)


This concludes my personal top 3 of FME 2016, I had lots of fun playing around with data this past year thanks to Safe Software and their great product.
I am expecting to have as much, if not more, fun with the upcoming FME 2017 functionalities.

The other top 3

Since the FME beta is always available and it's a great place to find out about new functionalities, I was searching for an idea for a post when I saw this tweet from @MadMansson which made me remember an old post where a list of certified FME professionals was created by parsing the HTML page of the Safe Software site.

So where does this all come together?  In FME 2017! where we can easily parse HTML with the brand new HTMLExtractor transformer (note to myself get cracking on CSS selectors).

So as a small homage to the previous post I put together a small workspace in which the countries with FME certified professionals are ordered by a ratio of the number of certified professionals per country divided by the country's area.

You might wonder what are the area units, well I just grabbed the first hit on Google for world countries shape and it is in the LL-WGS84 coordinate system.

Another thing to mention is that when I initially made the workspace Luxembourg was number one, but as you see recently somebody joined the club (welcome!) and now it is Singapore leading the list.

According to the same shapefile there are 43 other countries with a smaller area than Singapore, so if you are from Macau and you plan to get certified, I can promise you an eternal first on this list :)

The HTMLExtractor transformer makes it easy to grab information from the web pages and I personally think we will see more web related functionalities coming in FME 2017.

Looking forward to it!

Have a great New Year!


Sunday, June 7, 2015

Transformation made easy: the FME Cloud way.

FME Cloud provides the possibilities to have data transformed and served without any detailed knowledge of the data schema or even an application.

In my previous post, based on my FMEWT 2015 presentation, I have demonstrated how easy it is to send FME an email and let FME do the heavy lifting of getting the data, transforming it and making it available.
In that scenario the user only had to select the data and send the url.
In the next scenario the user already has some data which he needs translated. So here the email is sent with an attachment.

FME Server's email capabilities are described by a series of tutorials on the FME Knowledge Center (latest name for the old FMEPedia)
In the tutorials all the information necessary for making the most out of the incoming email is addressed.

The AERIUS project  was also presented on the FMEWT, since FME is everywhere....

The AERIUS calculator is one of the components of the national PAS project which results in a GML file.
Reading GML should not be an issue for a seasoned FME user and with the help of the Knowledge Center a beginner shouldn't have much of a problem figuring out how to point to the schema document and let FME do the work.


But what if you don't have FME or you are only interested in usable results?


Well the answer to that is: FME Cloud !

To demonstrate this I have used FME's powers to build a simple and easy to use AERIUS2FGDB translation.
The translation is event triggered which means you need to start it.


How? well that's easy:

  1. send an email to: fme@etlsolution.nl
  2. Email topic: AERIUS2FGDB_b28ba3b0-0da6-11e5-a040-028deac61efd
  3. Email attachment : AERIUS GML

Result?
The AERIUS GML gets translated to filegeodatabase (FGDB) and is made available via an email with a download link.

Are just interested in testing the methodology behind the product? I have already a AERIUS GML available for you to send as an attachment.

Interested in applying this for your organisation and your specific needs? dont esitate to contact me via itay@etlsolution.nl.

Free testing this product will be available from 8/6/2015 until 10/6/2015 between 9:00 AM and 16:00 PM (CET)

Monday, May 18, 2015

BGT via FMECloud

FME Cloud

What is FME Cloud? Simply put : FME Cloud FME Server in the Cloud. FME Cloud is the first location-aware iPaaS ( Integration Platform as a Service) and that means you have all the FME Server functionality at your disposal, without the hardware . 
See the following link for more information on FME Cloud.
One of the many advantages of FME Cloud is the ability to activate processes via an external trigger (e.i. event driven ) . Examples of such an external trigger can be an e-mail or a sensor value change

BGT

The creation of the BGT ( or The Registration Large Scale Topography as Goggle translate calls it ) is in full swing , many of the stake holders are feverishly working on the assembly of this nation scale polygon map. The first stage is expected to be completed on January 2016. Stake holders deliver their part of the BGT to the national facility (LV) and it is from there made ​​available in CityGML format via PDOK (Dutch national SDI). For an overview of the already available BGT in the LV see: BGTWeb 
The CityGML format cannot be directly used in GIS applications or loaded into a database,  a format conversion (something FME is great at ) must first take place.

Event driven BGT2FGDB conversion.

FME is the tool for spatial data conversion and FME Cloud is the cloud tool for spatial data conversion :)

The trigger

The format conversion is carried out with FME Cloud and is started via a trigger, in this case the trigger is an e-mail . There are some conditions that the trigger has to meet in order to start the process, for example a selected map tile link should be provided.

The conversion

During the format conversion a number of format -specific adjustments are done. Examples of these changes include: removing specific format invalid characters , conversion to uppercase , null values ​​mapping, date conversions, new geometry is created (think of house numbering and street names labels)

The result.

The result is a uniform and complete BGT data set in FileGeodatabase ( FGDB ) format. The FGDB is a widely used and efficient GIS format . This format can be used in both closed- and open-source GIS applications. After performing the format conversion , the result is made ​​available via an e-mail with a download  link.

Advantages and properties of the conversion are : 

  • Easy to use. 
  • No application is required. 
  • Online and always available. 
  • Reliably and quickly. 
  • Outcome ready for database read-in action and GIS applications. 
  • Unique : There is no comparable data distribution method ( in the Netherlands)

Results displayed in QGIS


This product is designed for the Dutch market if you are interested and want to set up something similar please contact us via info@etlsolution.nl

Wednesday, October 22, 2014

Heat maps and FME.

Heat map.

Heat map.

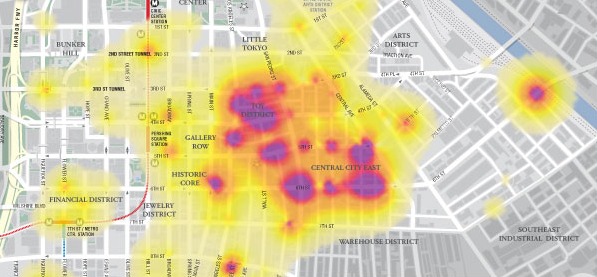
According to Wikipedia a heat map is a graphical representation of data where the individual values contained in a matrix are represented as colors.
In the past heat maps were mostly used in other sectors (biology, statistics, etc.) than the geospatial sector, where maps are the obvious way of data representation.
Nowadays there are plenty of resources to transform your data into a spatial heat map representation.


Google heat map.

The Google Developers site provides a multitude of resources and samples on how to used and incorporate Google's products. 
The Google Maps JavaScript demonstrates how a spatial heat map is created via a simple JavaScript.
Without going into too much details, the script's components include location data, a map center point and visualizations options (colors, gradients and additional functions)


JavaScript in FME.

If you mention JavaScript to an FME user, he will probably think you mean GeoJSON since that is the most common way for spatially representing Java objects (JSON or 'XML's Baby brother' )
There are dedicated readers and writers for JSON in FME and plenty of resources on the subject to be found at FMEpedia.
Since the script is essentially plain text, FME can be used to manipulate the script with a simple text writer.


Input.

highway location marker.
To demonstrate how essentially any spatial data can be represented by a heat map via FME, I made use of the national roads dataset (NWB) freely available via the Dutch SDI (PDOK)
The features used are highway location markers (point features) but also line and polygon features can be potentially represented via heat maps.

Workspace.

Actually it is a very simple workspace in which I am extracting the point coordinates into attributes, reprojecting them and concatenating them into the predefined order.
To extract the map center point a BoundingBoxAccumulator, CenterPointReplacer are used on the national border. Finally the CsmapReprojector transformer is used to bring it into the desired coordinate system (LL84).

Result.

The result is a html file that can be viewed with most browsers.
In this case I have only used FME on 3 script components and added some images into the header.
Potentially other components such as gradient colors and styling can also be directly manipulated.


The Netherlands - highway location markers heat map.


Wednesday, October 1, 2014

Georeferencing evaluation with FME.

FME and data evaluation.

FME is a great tool to validate and evaluate data (next to the many things you can do with FME)
There are plenty of resources available on the subject demonstrating FME's data validation and Q&A capabilities.

Data evaluation can involve different aspects and have many forms.
For this post I choose to evaluate how well a publicly available data set can be georeferenced (if you can add value to it and put it on a map, why shouldn't you...)
For any serious conclusions, you'll have to work it out yourself, since my main intention is to demonstrate FME capabilities (and not bad mouth anybody particularly...)

Data source.


The Dutch government publishes many data sets openly and the numbers are increasing all the time.
I choose to use the data set of the national education registry since it is highly dynamic and it contains addresses, which makes it possible to potentially georeference the features.

The data used is available in csv format, which can easily be accessed online via the CSV reader (just point it to the url). For limiting sorting and filtering the incoming data, see my previous post: Where clause on text.
This results in a continuously updated data source, which is great to have but poses a challenge when displaying the results.

 Georeferencing the data.


    For georeferencing the source data I am using the BAG Geocoding service, available via the National SDI.
    An easy way in FME to access the service is by a HTTPFetcher transformer.
    By constructing the URL in the transformer's text editor and making use of attributes values, a very flexible solution is created.

    BAG Geocoding service results.

    The BAG Geocoding service returns the location(s) in an XML snippet that translates into geometry and attributes. In case of ambiguity or lack of sufficient input, the service returns an aggregate geometry.
    Somewhere in the aggregate geometry the corresponding location and attributes can be found (well most of the times...)
    Using the total count of both georeferenced and failed features, simple statistics (percentage of correct georeferencing) can be gathered and used for display.

    HTTPFetcher

    Interpreting the results.

    Some of the 'failed' to georeference features do actually exist (BAG Web) and can be correctly geocoded by slightly changing the address used, see for example georeferenced (note the street tag) and not georeferenced (note URL used =  input address)

    Displaying the results.

    I am using Google Fusion Tables to display  the results since it is an easy way to share geographical information (article is in dutch)
    Also non-spatial data can be shared this way and the failed features are saved into a non-spatial Google Fusion Table. Needless to say FME supports both spatial and non spatial reading and writing of this format.
    Some limitations of this format are the number of features supported and that it is still considered an experimental format, something that unfortunately makes it less reliable.
    As mentioned before the input source data is updated frequently and in contrast the displayed results are static and present a moment in time.


    Map of results, created 1-10-2014.

    Findings and (possible) future developments.

    A way to keep the displayed results up to date would be to use FME Cloud, something I still have not got around to try. I imagine that using FME Cloud to run this workspace would not require almost any resources or adaptations, since most of the data is on-line.
    Some of the finding are:

    • Saving the source csv data is necessary due to memory issues (something that is easily done in the HTTPFetcher)
    • Another curious issue found is that using the postcode in the request string actually results in less features georeferenced.
    Don't forget that by the time you read this post the output might look very different.

    Monday, March 17, 2014

    Combining BAG and AHN2 Point cloud data.

    Data sources

    In previous posts , I demonstrated how the BAG data and AHN2 rasters can be accessed by FME.

    What I would like to demonstrate now, is how to fetch the AHN2 point cloud data and combine it with the BAG buildings.
    This in effect will show how easy it is to add the elevation values to the BAG buildings.
    The additional elevation information makes it possible for example to classify the buildings roof type (flat vs.slanting) and transform the 2D BAG buildings into 3D objects.

    BAG

    The BAG data was accessed for a small area of interest (AOI), this area contains 2D footprints of buildings.

    AHN2 Point Cloud

    Much like the AHN2 raster data, the on-line point cloud data can be easily accessed via FME. One of the differences in this workspace is that the FeatureReader transformer is used instead of the RasterReader.


    Combining the data

    For spatially relating features there are a few options, you can go for the 'old fashion' method by clipping the point cloud data for each building or by using the SpatialRelator, but my preferred way is to use the SpatialFilter.
    Why? well mainly due to performance issues and the fact that no extra transformers are necessary as is the case with the SpatialRelator.
    So after relating the features, the elevation information is in fact added to the buildings. (whether it represents the correct height is another matter, which is not addressed here).
    There are lies, damned lies and statistics - Mark Twain.

    So how to go about adding more than just the elevation information?
    Well after spatially relating the point cloud to each building, a number of statistics can be computed with the help of the StatisticsCalculator.

    This added information can be used for initial classification purposes, for example buildings with a low range value can be classified to have flat roofs.


    The Workspace.


    After creating the AOI (Creator) the BAG data is fetched off the Internet in the BAG custom transformer.
    For more info on how to do that see this previous post.
    The point cloud are, in much the same way, fetched from the web, unfortunately it is not possible to grab only the point cloud features of the AOI. 

    Point cloud AHN2 custom transformer.


    Once all data is read, combining it is done with the SpatialFilter and the StatisticsCalculator finishes the job by adding additional elevation statistics (don't forget the Group By setting)
    Note that I have opted for the summary port of the StatisticsCalculator, since I am no longer interested in the points themselves. (tip for good practice, drop anything you don't need ASP!!)

    To be able to share some results I have created a 3D pdf  that contains a building footprint (select it to view elevation statistics), point cloud data and additionally derived features (TIN, contours) (tip: download it, and open with Adobe, the web brouwser cannot display it correctly)
    Notice the spikes in the point cloud data and derived features, some of them can be attributed to the roof material, others to windows and lastly to vegetation (trees), how do I know? well here is a hint (switch to satellite and head north)

    Sunday, January 19, 2014

    FME 2013 in retrospect.


    FME 2014 release.

    Now with FME 2014 available, it is for me a time to reflect back on the changes made in the 2013 release.
    Thinking back on the adaptations made for FME 2013, especially the ones that I have used the most, I can truly say which are my favorites.

    1. Conditional processing FME 2013 SP1.


    Original FME Evangelist post
    Funny enough my first question on the FME Community was about such conditional processing.
    At the time it was only possible to achieve it with multiple transformers, testing and setting/mapping values (or an elaborate sql statement)
    With the introduction of conditional processing, the amount of transformers for such processing was reduced to 1 e.i. the AttributeCretor.
    The AttributeCretor has been replacing more and more transformers on the canvas, mainly testing and mapping transformers obviously.


    2.  Data Inspector FME 2013 SP1.

    Right from the start of 2013 I have been using the Data Inspector instead of the Universal Viewer.
    Since viewing the data in question, is such an essential part of the process of transformation, it's obvious that a capable tool for the job is needed.
    The Data Inspector for me is such a tool, especially since it did not only replaced the Universal Viewer, but outdated it too. The addition of the table view to the Data Inspector, did turn out to be a very useful addition that added a certain maturity to the all concept of data visualization within FME.
    The last Universal Viewer remnant, that I was missing, is now also been made available in the new FME 2014 release. Saving from the Inspector is now possible in two ways, saving all the features, or just the ones viewed.

    3.  New Excel reader/writer FME 2013 SP2.

    Blog post
    Several posts have been published in the past year about the new Excel reader and writer. It is truly an major improvement to the old reader/writer, supporting formulas, colors and a wider range of data types (XYZ coordinates to geometry), just to mention a few.

    Surprisingly the new reader does not support a where clause, as the old reader did, I am still puzzled about this, especially since Excel is treated as a database. Possibly the underlying technology change is the cause of this reader parameter missing in the new reader.

    The handling of multiple schema, especially originating from multiple feature types, is still an unresolved issue. Even then the advantages of the new Excel reader/writer capabilities greatly outweigh these few introduced glitches.


    So there you have it, these are my favorite and most used FME 2013 improvements I wanted to share.
    Now with that out of the way I can send more time on FME 2014 in future posts exploring the sea of opportunities.

    Have a feeling the it will all be about nothing.....


    Tuesday, November 5, 2013

    Bye Bye Universal Viewer


    What is the first thing they teach you in a FME course? To have a look at the data !

    All the way back to my first careful steps with FME, the Universal Viewer was there to help visualize and query the data I was working with.

    A great tool and without it, it would have been unthinkable to work with any type of data.

     FME Universal Viewer
    Since the first appearance of the next generation viewing application of FME (Data Inspector), I have been hesitant to make the transition from the known and familiar Universal Viewer to the new Data Inspector.

    Sure there have been moments when I thought OK now I am finally going over to the Inspector, I mean its fancy and you can view in 3D (That was back in the days when the 3D was hot). But somehow I never got around to finally take the final step.
    ???
    Since FME 2013 was released I have been only using the Data Inspector (I remember somewhere in the beginning of 2013 that the FME Evangelist himself made the transition and naturally recommended it to us all).
    Throughout 2013 a number of features have been added to the Data Inspector (background maps, table view) that made the Universal Viewer really seem old fashioned.
    The only Universal Viewer functionality I still miss in the Data Inspector is the ability to save the viewed features.

    So bye bye good old Universal Viewer I suspect I wont see much of you anymore (wasn't FME 2013 also the last release with the Universal Viewer?)

    And for those of you that still cling to the Universal Viewer, take the final step it's worth it!

    It's something unpredictable, but in the end is right, I hope you had the time of your life.
    - Green Day

    Friday, October 11, 2013

    FME Template


    The ability to save workspaces as templates was added in FME 2011.
    If you keep preforming the same actions, for example use a reader's bounding box settings, then this is something you should consider.

    A template is basically a saved workspace, in which you can have as many transformers and readers in it as you like or none at all.
    None at all? well yes actually the one I use the most doesn't have any transformers (yet) and only one reader and an inspector.

    If you are a heavy database user then consider the following:
    • You constantly need to access data from different services with different users/passwords and you want a to spatially select the data and tables from where the data comes from.

    You can create a workspace from scratch each time, but if you hate repetitive and not particularity efficient tasks (like me) then a template can save you lots of time (which you can spend on the fun part = transformation)

    To make the template as flexible as possible I make use of many parameters (private and published).
    These parameters assist me to define the database service, user name, password, feature types (tables), where clause and location (bounding box) when running the workspace (prompt and run)

    Prompt window

    The only action I actually have to do is to select my translation source parameters and run, viola!

    Wednesday, October 9, 2013

    Search feature

    As a seasoned FME user you are probably aware of the fact that a reader's bounding box coordinates settings are an efficient way to read only data which is spatially relevant for your location.

    A little less known option, native to the FME  ESRI database readers (SDE and Arc Objects GDB  is the search feature. This option lets you use the reader (actually the underlaying database) to preform a selection of spatial selection based on a feature.

    To make use of this functionality requires a little bit of preprocessing if you don't have the search features in the necessary format.
    Let's take an example to make this clear.
    • Lets say you have projects boundaries polygons available (doesn't matter in which format since FME is the champion of formats) and you want to use these features as a search feature on data in an SDE or GDB database.
    • You basically need to convert your boundaries into the format accepted by the search feature setting (space delimited coordinates)
    • This can be easily done with FME (see the CoordinateConcatenator transformer >FME 2013)
    What I ended up with is a space delimited csv file:
    Search features read by the csv reader

    • Now it is time to implement it on the database reader, go to the Navigator> Parameters > Advanced > Search feature
    • Create a parameter from the setting (right click > Create user parameter), select choice with alias (multiple).
    • In the parameter's configuration setting select the import option, this will basically open a wizard (much the same as a normal reader) in which you can select the csv file created.
    • Make sure you correctly select the values and alias fields and you will end up with a selection menu for the search feature.

    Selection of search features when prompting

    As the name of the setting suggests you can only select one feature, and if you intend to have a selection from multiple features: the FeatureReader is the way to go.

    You might think 'pfff.... I can use the FeatureReader ' well you can!! as in all things FME there are many roads that lead to the desired results but since this functionality exists, why not make use of it?


    Sunday, July 21, 2013

    First rumblings


    Where to start.....


    I guess a bit of free typing wont hurt at this stage, I mean nobody is actually going to read this? right?
    My conclusion is quite easy for me to understand and argue, but for any other some clarifications are needed.


    My initial idea was to create a personal log that one day might take shape into a full grown blog, this soon took another form, an blog to promote/add exposure to my self.

    Shortly, I am (or trying to be) a freelance spatial ETL professional, I live in the Netherlands one of the most advanced geospatial nation in Europe. 
    Because of that and the amount of competition in the geospatial market, exposure is critical for a start up business.

    BTW did I mention FME?


    More on that later....