Wednesday, October 22, 2014

Heat maps and FME.

Heat map.

Heat map.

According to Wikipedia a heat map is a graphical representation of data where the individual values contained in a matrix are represented as colors.
In the past heat maps were mostly used in other sectors (biology, statistics, etc.) than the geospatial sector, where maps are the obvious way of data representation.
Nowadays there are plenty of resources to transform your data into a spatial heat map representation.


Google heat map.

The Google Developers site provides a multitude of resources and samples on how to used and incorporate Google's products. 
The Google Maps JavaScript demonstrates how a spatial heat map is created via a simple JavaScript.
Without going into too much details, the script's components include location data, a map center point and visualizations options (colors, gradients and additional functions)


JavaScript in FME.

If you mention JavaScript to an FME user, he will probably think you mean GeoJSON since that is the most common way for spatially representing Java objects (JSON or 'XML's Baby brother' )
There are dedicated readers and writers for JSON in FME and plenty of resources on the subject to be found at FMEpedia.
Since the script is essentially plain text, FME can be used to manipulate the script with a simple text writer.


Input.

highway location marker.
To demonstrate how essentially any spatial data can be represented by a heat map via FME, I made use of the national roads dataset (NWB) freely available via the Dutch SDI (PDOK)
The features used are highway location markers (point features) but also line and polygon features can be potentially represented via heat maps.

Workspace.

Actually it is a very simple workspace in which I am extracting the point coordinates into attributes, reprojecting them and concatenating them into the predefined order.
To extract the map center point a BoundingBoxAccumulator, CenterPointReplacer are used on the national border. Finally the CsmapReprojector transformer is used to bring it into the desired coordinate system (LL84).

Result.

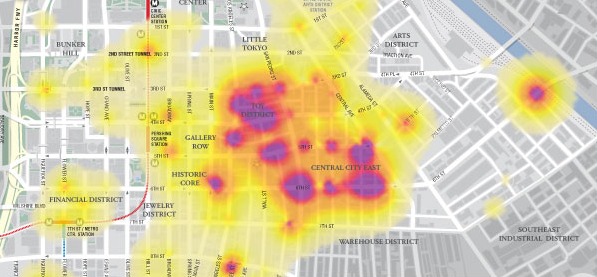
The result is a html file that can be viewed with most browsers.
In this case I have only used FME on 3 script components and added some images into the header.
Potentially other components such as gradient colors and styling can also be directly manipulated.


The Netherlands - highway location markers heat map.


Wednesday, October 1, 2014

Georeferencing evaluation with FME.

FME and data evaluation.

FME is a great tool to validate and evaluate data (next to the many things you can do with FME)
There are plenty of resources available on the subject demonstrating FME's data validation and Q&A capabilities.

Data evaluation can involve different aspects and have many forms.
For this post I choose to evaluate how well a publicly available data set can be georeferenced (if you can add value to it and put it on a map, why shouldn't you...)
For any serious conclusions, you'll have to work it out yourself, since my main intention is to demonstrate FME capabilities (and not bad mouth anybody particularly...)

Data source.


The Dutch government publishes many data sets openly and the numbers are increasing all the time.
I choose to use the data set of the national education registry since it is highly dynamic and it contains addresses, which makes it possible to potentially georeference the features.

The data used is available in csv format, which can easily be accessed online via the CSV reader (just point it to the url). For limiting sorting and filtering the incoming data, see my previous post: Where clause on text.
This results in a continuously updated data source, which is great to have but poses a challenge when displaying the results.

 Georeferencing the data.


    For georeferencing the source data I am using the BAG Geocoding service, available via the National SDI.
    An easy way in FME to access the service is by a HTTPFetcher transformer.
    By constructing the URL in the transformer's text editor and making use of attributes values, a very flexible solution is created.

    BAG Geocoding service results.

    The BAG Geocoding service returns the location(s) in an XML snippet that translates into geometry and attributes. In case of ambiguity or lack of sufficient input, the service returns an aggregate geometry.
    Somewhere in the aggregate geometry the corresponding location and attributes can be found (well most of the times...)
    Using the total count of both georeferenced and failed features, simple statistics (percentage of correct georeferencing) can be gathered and used for display.

    HTTPFetcher

    Interpreting the results.

    Some of the 'failed' to georeference features do actually exist (BAG Web) and can be correctly geocoded by slightly changing the address used, see for example georeferenced (note the street tag) and not georeferenced (note URL used =  input address)

    Displaying the results.

    I am using Google Fusion Tables to display  the results since it is an easy way to share geographical information (article is in dutch)
    Also non-spatial data can be shared this way and the failed features are saved into a non-spatial Google Fusion Table. Needless to say FME supports both spatial and non spatial reading and writing of this format.
    Some limitations of this format are the number of features supported and that it is still considered an experimental format, something that unfortunately makes it less reliable.
    As mentioned before the input source data is updated frequently and in contrast the displayed results are static and present a moment in time.


    Map of results, created 1-10-2014.

    Findings and (possible) future developments.

    A way to keep the displayed results up to date would be to use FME Cloud, something I still have not got around to try. I imagine that using FME Cloud to run this workspace would not require almost any resources or adaptations, since most of the data is on-line.
    Some of the finding are:

    • Saving the source csv data is necessary due to memory issues (something that is easily done in the HTTPFetcher)
    • Another curious issue found is that using the postcode in the request string actually results in less features georeferenced.
    Don't forget that by the time you read this post the output might look very different.

    Sunday, September 7, 2014

    FME and 3D printing.

    3D printing.

    3D printing has been around since the 1980's, but it is only in the last few years that a real boom in its application has taken place especially for domestic use.
    The most commonly used format (e.i de facto standard) is the STL, which comes in two types (ASCII and Binary).
    3D print.

    STL format and FME.

    If you search for this format in the Readers and Writers documentation, you will find that FME does not support it.
    Well not directly since no reader or writer are available, but indirectly, because it is plain text and FME can create and write STL files.

    3DS to STL transformation.

    There are lots of 3D files available on the web, and since it was around lunch time... I have selected this fork for testing.
    3DS in the Data Inspector.
    The 3DS fork is represented as a IFMEMesh geometry, which is to say that it is composed of parts that do not necessarily have a topological or spatial relationship.

    These are also the parts that need to be represented in the STL format, adhering to simple format definitions.

    So its not surprise that with FME the mesh geometry can be transformed and written to the STL format.

    Workspace.

    The workspace is quite simple and there are but a few steps necessary.
    1. Firstly decomposing the geometry to its components.
    2. the coordinates are extracted into attributes, here is also where I drop the geometry since it is not needed anymore (get rid of anything unnecessary, another FME rule).
    3. Some formatting is taking place to represent the coordinates as floating point numbers (StringFormatter), although some applications export into STL without the floating point representation.
    4. Finally creating the output by aggregating the coordinate values and concatenation.
    A text file writer is all that is necessary to write the STL format.

     Result.

    Result STL file.
    Since FME does not support the STL format it cannot be viewed in the Data Inspector, but no worries there are plenty of visualization tools available.
    I am using the freely available Meshmixer to display the result.

    I dont have a 3D printer, so in case you have tried yourself to create a STL file with FME and printed the result, it would be great to know.

    Saturday, August 16, 2014

    Where clause on text.

    Where clause.

    A where clause in its basic form is used to filter features and is used with database formats.
    The use of a where clause can deliver workspace related efficiency, by resulting in only the features necessary for the translation.
    You can do much more in a database where clause (joins, sub-queries), but for the purpose of this post I will stick to its basic use (e.i filtering)


    Example.

    Inspired by Safe's blog post, I have downloaded some bird tracking data* from the Movebank Data Repository .

    The data comes in a csv format, which is considered a database format in FME, but is actually plain text. The goal is to present the features on a map.

    Cory's shearwater - going the distance.

    Data content.

    The csv file contains location information as lat/long coordinates among other types of sensor related information.
    For more information about the data see the readme file provided.


    Data transformation.

    read data that cannot be used ?
    To transform the location information into point features the VertexCreator transformer can be used.
    However when doing so, disregarding the first law of FME (which is?), the transformation will halt because some features do not contain values in the location columns.
    That can be easily solved by testing the data before creating the geometry. 
    But by reading the entire dataset and then filtering unnecessary (or unusable) features, you are reading more than is necessary and it is not efficient.
     

    Filtering while reading.

    To my surprise, I have stumbled across a new functionality in the csv reader, that enables such filtering.
    I say to my surprise, since I totally missed out on the announcement related to this addition.
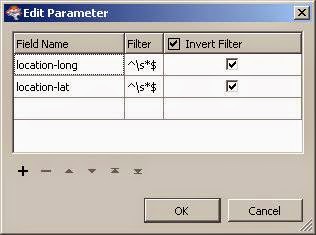
    This functionality is found at the csv reader parameters. First you have to enable it and then set it.

    According to the documentation: "The filtering is done by a regular expression string that will be compared against the values of attribute fields specified."

    This means that if you know your regular expressions, serious complex filtering can take place.

    For this case it is a simple string that filters the lat/long attribute fields, returning only columns in which values are found.
    Simple regular expression.

    Workspace.

    With and without filtering.
    This new functionality offer new possibilities that did not exist before FME 2014. And even if it's not a where clause as in a database, the abilities to filter and sort are welcome useful additions.


    * Gagliardo A, Bried J, Lambardi P, Luschi P, Wikelski M, Bonadonna F (2013) Oceanic navigation in Cory's shearwaters—evidence for a crucial role of olfactory cues for homing after displacement. Journal of Experimental Biology, v. 216, p. 2798-2805.


    Saturday, August 2, 2014

    Built in geometry validation.

    Post origin.

    The idea for this post comes from a tweet by a FME user (thanks Richard!) and since it is cucumber time I thought what the heck why not try it out myself.

    Geometry validation in FME.

    The GeometryValidator is the transformer for geometry validations in FME. To be able to validate the data you need to read it into the workspace.

    valid?
    With database formats, with their built in ability to validate geometry, validation and tagging can take place when reading.
    In Oracle that can be done with the geometry-related PL/SQL subprograms in the SDO_GEOM package.
    In this case I am using the sdo_geom.validate_geometry_with_context  subprogram to locate and tag geometry errors.

    Built in geometry validation in the Oracle reader.

    To validate the data while reading, the SQL statement should be used in the feature types parameters select statement (not to be confused with the reader select statement)
    When configured correctly both valid and invalid features are returned.

    As you all know, databases return error's as a number and error location and that there are internal ways to use existing database capabilities to make the error's more human readable.
    But since FME is great at reaching out to the web, grabbing data and making use of it, what can be better (and more fun) than parsing the web pages with the error's descriptions and adding it to the features?

    Adding error descriptions.

    Since I am using Oracle, the logical place to search for error's descriptions is the Oracle on-line documentation. Grabbing the web page is done with the HTTPFetcher, parsing it with the XMLFragmenter and then it's a matter of testing for the correct string. To finish it up I have created a custom transformer that does exactly that.
    Workspace.


    Useful?

    As in most things FME, there are many ways to achieve the the same result, and it's a matter of personal preference and experience on how one approaches a problem. That said, a problem should not be the sole reason for using FME. It can also be just for fun.
    So is it useful to have built in geometry validation and tagging? well I guess it is since otherwise why would anybody try?
    Some other advantages might be:
    • Awareness of  geometry error's (do you assume the data is always geometrically correct?)
    • The option to act upon that awareness.
    • Reducing the number of features that need repair. In translations that involve a high volume of data and long computations, reducing the number can result in gaining workspace related efficiency.

    Results.

    Monday, May 19, 2014

    All PDOK atom feeds in FME.

    Recently I was approached about accessing atom feeds services from the Dutch national SDI (PDOK).

    After writing several posts on the subject I realized that having access to all of the atom feeds services in FME, would be a nice challenge and a useful addition.
    So I set about figuring out what would be the best way to set it up. I realized that I wanted to have the option to select an individual service or several of them.

    How to get all the URL's

    Normally the GEORSS reader is used to access a XML feed.
    To be able to access a service you would have to select the URL from the web page and paste it into the reader.
    This approach works fine, if you access a couple of services, but I would like to have them all selected.
    Especially when new services are added or deleted.
    Once I have all of them I can choose the ones I would like to use in my workspace.

    Well since FME is great at accessing data on the web, Why not use it to retrieve the URL's of all the services?

    The PDOK site is built with a certain logic, all of the services are alphabetically ordered.
    Using that logic in FME enables you to select the services by accessing the HTML pages displaying the services on the PDOK website.


    PDOK web page HTML
    The XMLFragmenter can slice through the web page HTML like any other XML document.
    Parsing the XML (another great feature of FME) enables the final selection of the URL's.

    FME workspace

    Result

    So after some XML parsing I got a list of all of the current PDOK atom feed services.
    You might think, well I can just sit and copy paste the URL's into a text file.....well sure you can! nobody is stopping you :)
    But by using FME and it's XML capabilities, you always end up with an updated list.
    When services are deleted or new ones introduced, the resulting list will reflect that.
    Beside that, once you have the services list available, you can continue your data transformation, something which is not really possible with a text file :)

    Atom feeds services list.


    Atom feeds in FME

    As with anything FME, there are more ways to skin the proverbial cat ;)
    One way of using the services list in a workspace, can be by using a startup python script.
    Yet another way would be to wrap the workspace into a custom reader, so that it can become part of your regular FME readers.

    And finally you can just opt to continue developing the workspace.
    There are quite a lot of FME transformers dedicated to web services, two of them are specific for GEORSS feeds.
    In this scenario the GeoRSSFeatureReplacer is very useful to extract all the information from the server response into attributes.

    Services selection

    The services selection should be done at run time to provide extra flexibility.
    This is where a TestFilter and user parameter combo comes in handy.
    To retrieve the parameter value(s) into my workspace, I use the so adequately named :) > ParameterFetcher
    Then it's a simple matter of setting up the correct test to retrieve the selected services.

    So to wrap it up:
    1. Now I have a new PDOK atom feeds reader in FME, and I know for sure that it will always provide me with an updated list of services. 
    2. As you know FME is a no code approach. 
    3. With just 8 transformers the workspace is super simple.
    Life made easy the FME way, interested? give me a call.


    Monday, April 7, 2014

    FME and Open Geospatial Consortium (OGC) Sensor Observation Service (SOS)

    Sensor Observation Service (SOS)

    The Open Geospatial Consortium (OGC) implemented the SOS standard
    that basically returns sensor and observation data via XML. (yey!)
    3 main functions are supported:
    1. GetCapabilities - what server provides
    2. DescribeSensor - information about a sensor
    3. GetObservation - observation data

    Naturally with FME all of these functions can be accessed and the data retrieved to any supported GIS and database format.


    FME and web services.

    There is already a great webinar displaying how, without a single line of code, a variety of web services are accessed and made with FME. In the webinar the observation data is displayed in the Data Inspector (with a background map) and the table view is used to sort the measurement values.
    As with all FME webinars, the workspaces are made available.
    Demo workspace

    IOOS Demo Workspace.

    After viewing the webinar, downloading the workspaces and exploring them, I wanted to expand the SOS demo by retrieving the sensor information.
    The demo workspace is well annotated and the use of bookmarks is demonstrated.
    By the way, did you notice that once you use bookmarks, you actually have your technical design?


    Demo workspace +
     In the developed version of the workspace the upper part is the same as in the demo.
    I did , however, change the location of the creator and ParameterFetcher, to be able to distinguish between the service functions.

    The added parts are far from complicated, and that is actually the beauty of it, with no code and a minimal number of transformers all data can be easily retrieved.


    The sensor information retrieved also contains the sensor location (among other things) to be able to share these results I have created this Google map (with FME, naturally...) that shows the location of the stations.
    One of my favorite locations is Sand Island, Midway Islands. Does anybody know what species are all those bird chicks..? 
    Google Street View